A data-based analysis of College Football "Blue Bloods" and Oklahoma State’s changing place in that story Updated January 2020
In August of 2018 a “Blue Blood” comment got me curious about what technically makes a Blue Blood. We all inherently know the Blue Blood programs. They are historically good. Being “great” for a just a few years doesn’t cut it. But I wanted more details. What’s the data behind the reputation? How does it change over time? How does Oklahoma State fit into the Blue Blood story and how are we trending? This triggered an investigation to pull some data into a spreadsheet and see what it tells me. I did my initial analysis prior to the 2018 season and then updated it following the 2018 and 2019 seasons.
I started with a quick Google search and found a 2016 ESPN article titled, “Which schools should be considered college football royalty?". I took their Top 60 as a starting point (a cutoff which included OSU as tied for #32). Then I independently created my own data-based criteria and began building the spreadsheet and making some observations. I wanted to see if my ideas as to what constituted a “Blue Blood” would create a list similar to the one made by the sportswriters at ESPN. Naturally, I also wanted to view the data through orange-colored lenses too. This article contains my methodology, results and observations. To get to a concluding punchline… I think Oklahoma State is in the process of elevating the level the program in a manner that is extremely rare in collegiate football. We are the only program substantially rising in the college football ranks with a long-standing history in a P5-equivalent conference and a direct rivalry with one of the nation’s elite programs. Quite the accomplishment-in-the-making for Coach Gundy, Coach Holder, Mr. Pickens, and all the players & staff associated with Oklahoma State football in recent years.
To create my ranked list, I needed to establish criteria and associated point values. I based my criteria on readily-available data and subjectively assigned points based on what I thought was important.
My Criteria:
Championships – This is what really matters, right? Each Natty is worth 10 points. Since there is no clear NCAA champion in CFP, I took the championships “claimed” by each school on the ever-reliable source… Wikipedia. Yes, OSU claims 1945… but we don’t claim the 2011 championship selected by “Colley Matrix”. Alabama claims everything.
Wins – There’s a reason we track Win/Loss records. Seems secondary in importance only to Championships. Each win worth 0.1 point. No points for ties. Source: sports-reference.com/cfb/schools. To keep it simple, I did not make adjustments applied after the fact by the NCAA (e.g., USC gets 11 wins for 2005, not 0).
Heisman Trophies – Each Heisman is worth 10 points. The ultimate individual award – but one that requires program excellence and brings a lot of visibility to the program. Source: Each program’s Wikipedia page.
Bowl Games – Part of the pageantry and tradition of College Football. 1 point for an appearance in a Bowl… 2 more for winning the game. Source: Source: sports-reference.com/cfb/schools.
College Football Playoff/BCS Championship Game Appearances – Each appearance is worth 5 points (win or lose). This metric has some recency bias as the BCS Championship Game has only been in effect since the end of the 1998 season. But still seemed appropriate to recognize significance of reaching the “Final Four” (or Finals) equivalent. Source: Source: sports-reference.com/cfb/schools.
Conference Championships – Each Conference Championship is worth 3 points. I debated whether to include this, since it works against Independents like Notre Dame, Penn State (for much of their history), and Army. But I ultimately decided that claiming a championship – and the publicity that goes with it – is relevant to the discussion. Source: Usually each program’s Wikipedia page.
And finally…
History – History is clearly important, but recent history is more important. I addressed this by creating four eras and discounting the value of points depending on how much dust is on the trophy. Here are the eras: 1) “Pre-1950” (think leather helmets) – 20% weighting, 2) “50’s/60’s/70’s” (think single-bar facemasks) – 50% weighting, 3) “80’s-90’s” (think massive shoulder pads) – 80% weighting, and 4) “2000+” (think HD TV highlights) – 100% weighting. This means that OSU’s claimed 1945 National Championship is only worth 2 points (10 x 20%).
Other criteria I considered but eliminated to keep things simple or because I didn’t know where to get data (or didn’t want to spend the time getting the data!) included 1st Round Draft Picks, Recruiting Rankings, Consensus All Americans, “New Year’s Six” Bowls (or similar premium for an upper tier bowl), etc. Ultimately, I figured that information would just reinforce the data I was already collecting.
Summary of Results and Observations
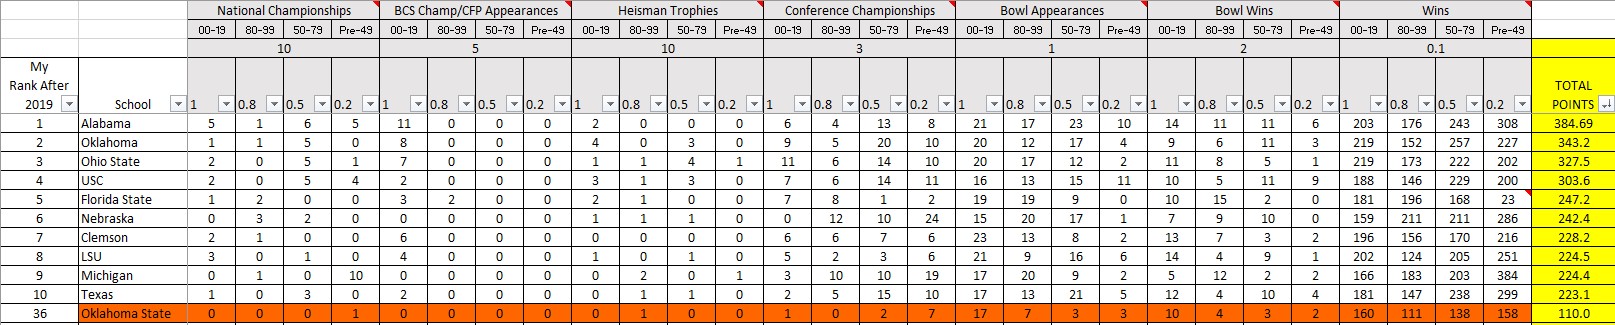
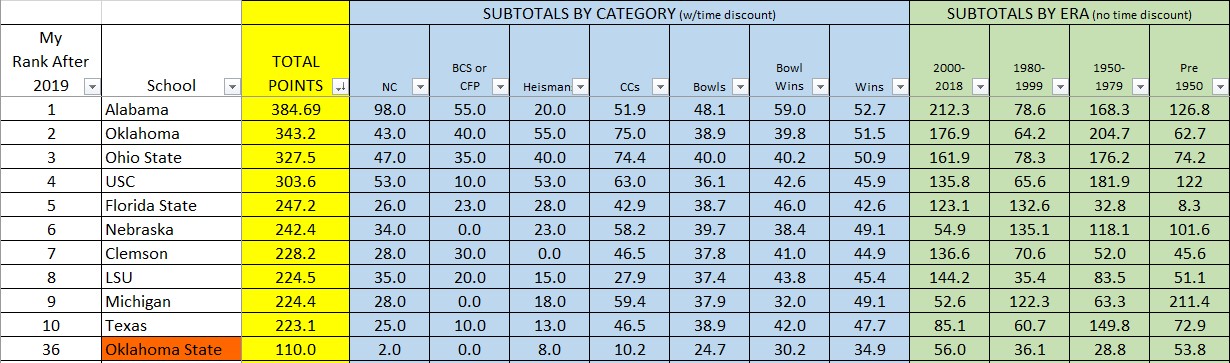
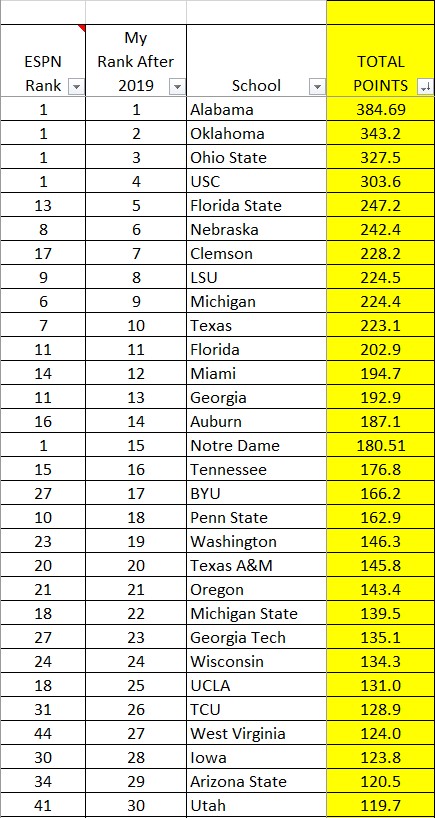
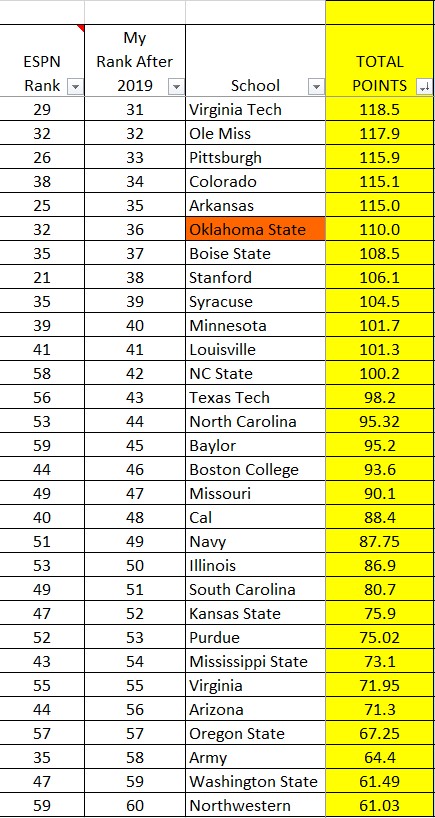
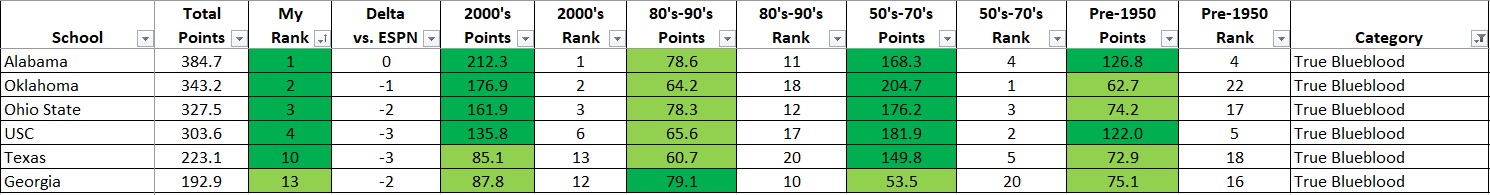
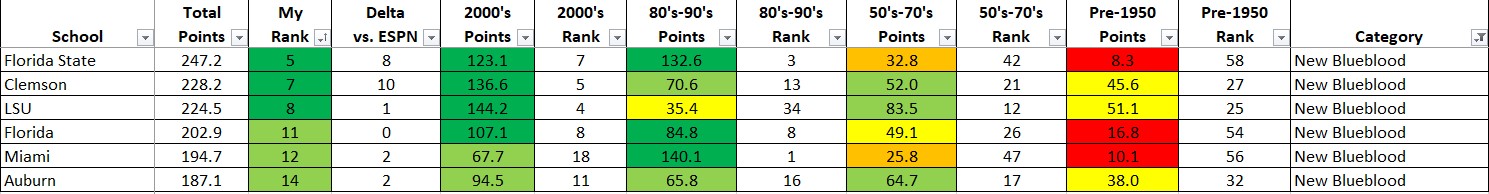
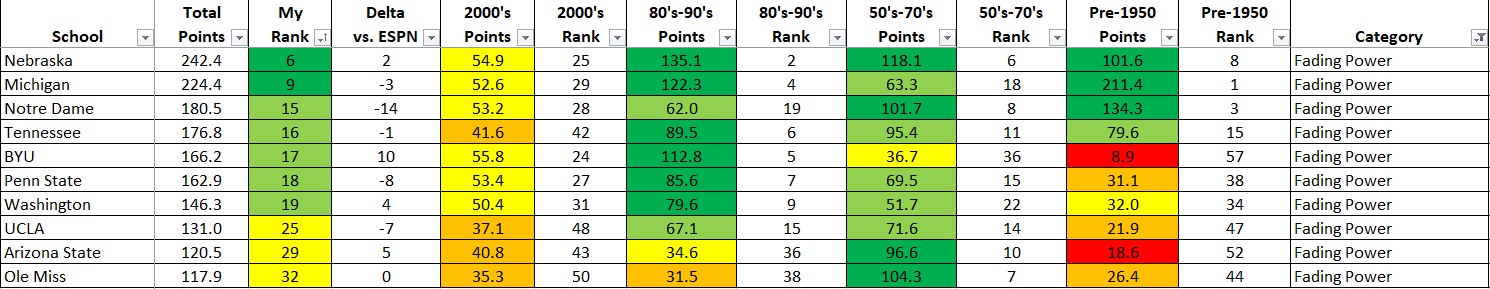
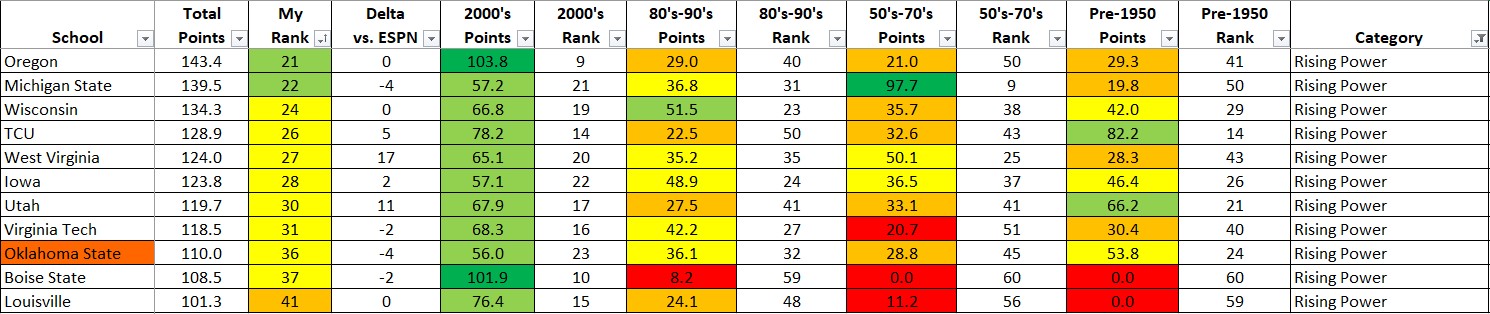
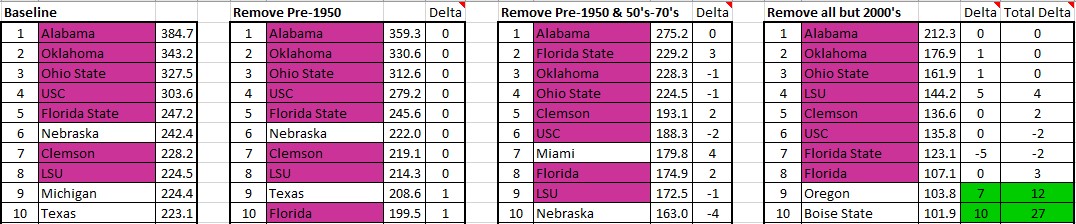
As expected, my ranking closely mirrored ESPN’s list. In fact the Top 20 of both lists were the same schools except for two – my list included BYU and Washington and did not include Michigan State and UCLA. In my analysis, BYU benefitted from many small conference championships over the years and Washington benefitted from 3 (old) national championships. Independents did indeed suffer in my rankings without points from conference championships. And less traditional schools tended to place a bit higher in my rankings as there was not a premium placed on “Power 5” wins. The images are eye-charts, but they show the Top 10 from my rankings (plus Oklahoma State) with the values driving ranking points as well as points obtained by category and era. Also shown are images of the full “Top 60” and how my ranking compares to ESPN’s list.
Top 10 (plus Oklahoma State) – Raw Data and Total Points
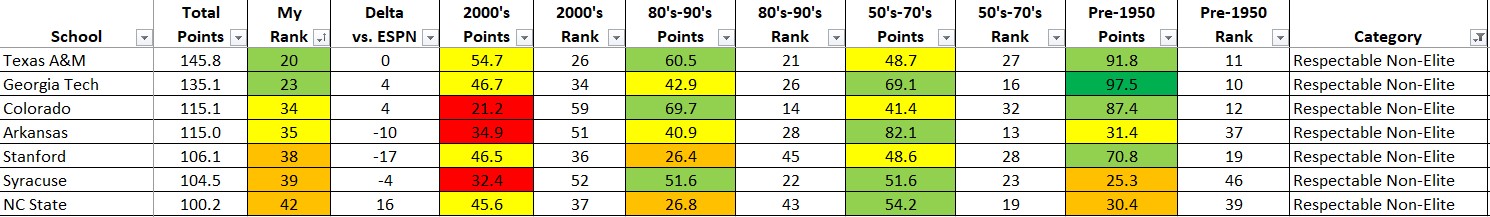
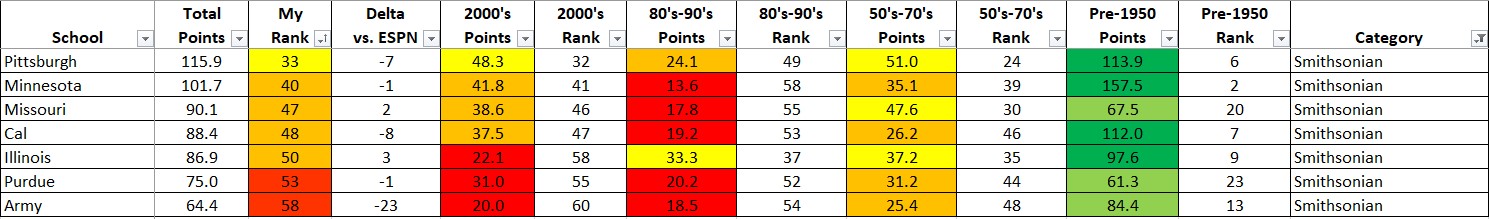
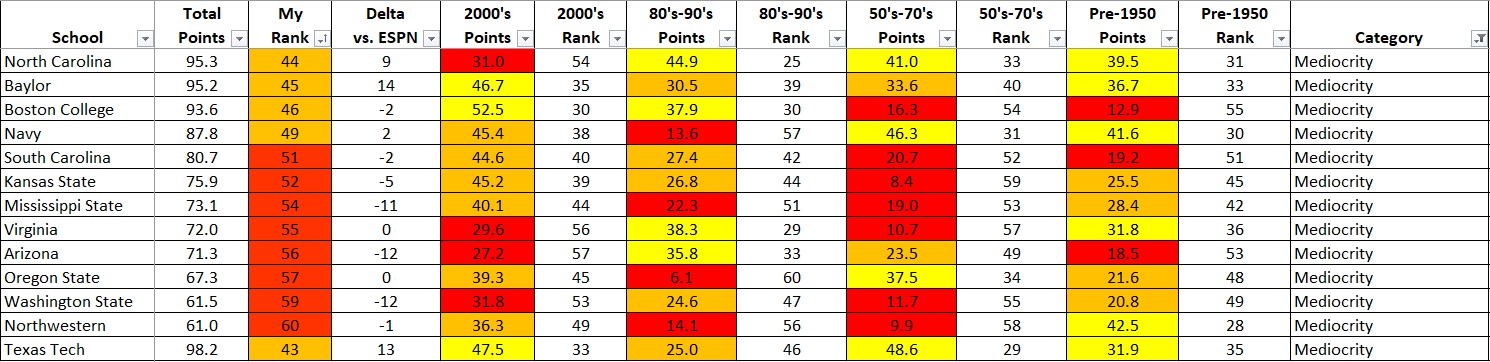
It was really interesting to study the trends of the programs over the course of the four eras. I grouped the programs into 5 “buckets” in each era – the elite Top 10 (dark green), the next 13 (light green), the middle 14 (yellow), a lower 13 (orange), and the Bottom 10 (red). By grouping and sorting with these colors, I subjectively created seven “categories” for the 60 college football programs. These labels are: True Blue Bloods, New Blue Bloods, Fading Powers, Rising Powers, Respectable Non-Elite, Mediocre, and “Smithsonian”.
True Blue Bloods: Alabama, Oklahoma, Ohio State, USC, Texas, Georgia. These are the only programs that are “green” in each of the eras. As recently as two years ago Nebraska was hanging on in this group, but the 2010’s were not kind to fans in Lincoln. Each of the programs in this category have won at least one championship in the 2000’s. It is interesting that the top 4 from this category in the 2000’s (Alabama, Oklahoma, Ohio State, and USC) were the same top four in the 50’s-70’s – but they were all outside the top ten in the 80’s-90’s.
New Blue Bloods: Florida State, Clemson, LSU, Florida, Miami, Auburn. These programs were not “green” across the board like the True Bluebloods, but other than LSU they have been green since the 80’s-90’s era and all have won a championship in the 2000’s. Half of these programs were strong as far back as the 50’s-70’s – Clemson, LSU, and Auburn. Auburn is a borderline member of this group since they aren’t in the top ten for any of the four eras (but they’re #11 for the 2000’s). Interestingly, all six of these New Blue Bloods are from the south.
Fading Powers: Nebraska, Michigan, Notre Dame, Tennessee, BYU, Penn State, Washington, UCLA, Arizona State, Ole Miss. These programs are all in the middle/lower tiers (yellow/orange) for the 2000’s but have dropped noticeably from peaks in the 80’s-90’s and/or the 50’s-70’s. With the exception of UCLA, each of these programs ranked in the top ten in one of the previous eras (the highest rank for the 2000’s is 24th by BYU). Several of these programs – including Nebraska, Michigan, and Notre Dame – would classically be referred to as Blue Bloods. But their on-field performance spanning 2000-2019 drops them to this category despite some strong individual seasons. However, none of these programs has won a National Championship in the last twenty years.
Rising Powers: Oregon, Michigan State, Wisconsin, TCU, West Virginia, Iowa, Utah, Virginia Tech, Oklahoma State, Boise State, Louisville. An interesting list of programs with “green” success in the 2000’s, but nothing of note in prior eras other than Michigan State who had a top ten ranking in the 50’s-70’s. Oregon is Top 10 for the 2000’s and is closest to being able to break into the “New Blue Bloods” category, but a particularly weak history prior to the 2000’s leaves the Ducks on the outside looking in for now. Several teams in this category, including TCU, Utah, Virginia Tech, Boise State, and Louisville have long histories outside “P5-equivalent” conferences.
Respectable Non-Elites: Texas A&M, Georgia Tech, Colorado, Arkansas, Stanford, Syracuse, NC State. All of these programs have an era or two in the green but nothing of substance in the 2000’s. “Respectable” is an adjective earned historically, not recently. I was surprised to see Stanford land here, but they only have 11 bowl appearances and 5 bowl wins in the 2000’s. Colorado is really struggling since their move to the Pac 12 and is barely hanging on in this category.
Smithsonian (a Blue Blood of a bygone era): Pittsburgh, Minnesota, Missouri, Cal, Illinois, Purdue, Army. There is a lot of dust on these trophies for these programs and not much success since the 50’s. Sure, there are great seasons here and there, such as Minnesota in 2019. But only Pittsburgh has managed to stay out of the bottom ten since the Pre-1950 era. ESPN clearly included these programs in their original list due to their accomplishments a long time ago.
I agree with your broad conclusion/opinion
Given the landscape change in NCAA football over last 15 yrs AND Okstate FB history…to be in the top 50% of P5 schools is an accomplishment …hopefully the next decade will propel OSU to top 25% of P5
Mediocrity: These programs never scored well enough in any of my four eras to hit the “green”. Each has probably had decent stretches of ~5 years, but not enough across a 20-30 year period. Baylor and Texas Tech are the only programs in this list who never landed in the Bottom Ten (red). But since this is my list, it made me happier to include them here than to bump them up into the “Respectable Non-Elite” category.
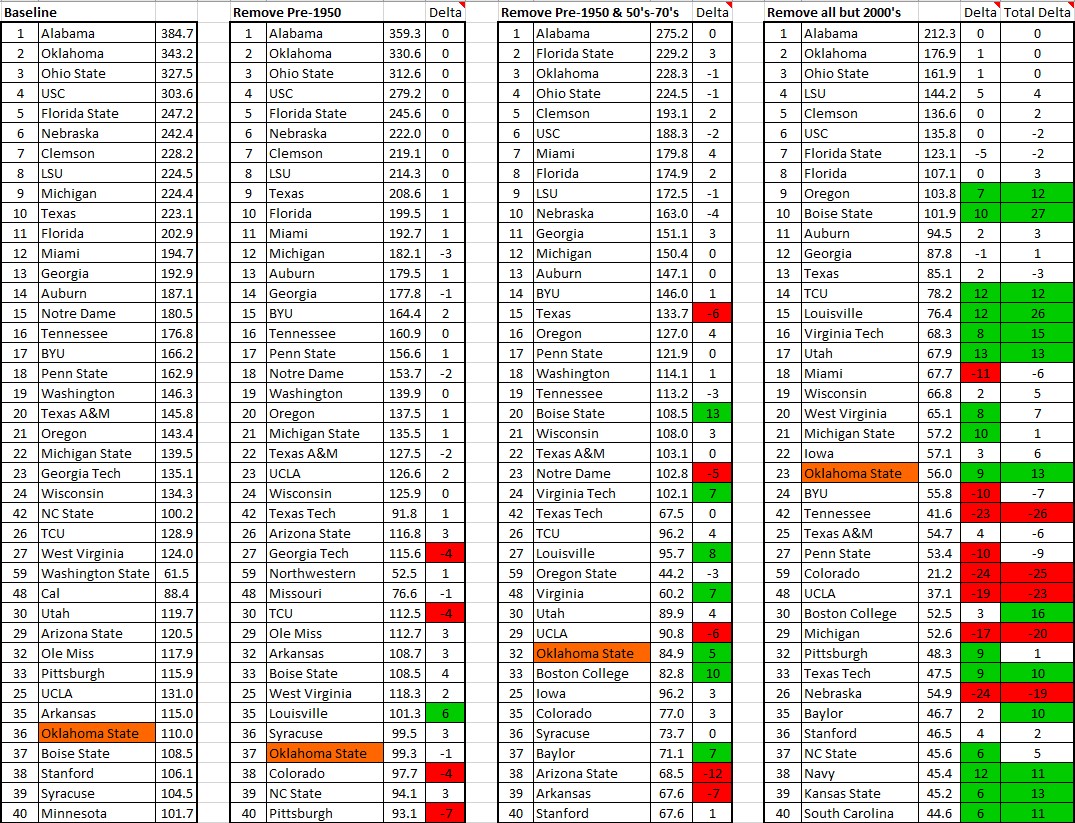
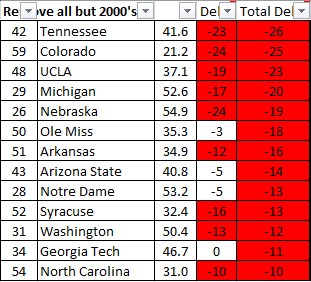
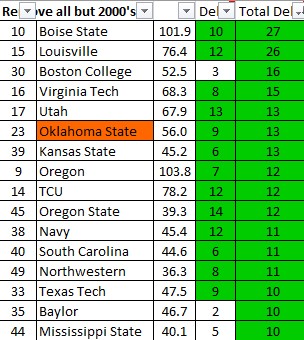
After studying the data from this perspective (with rankings from all eras comprehended), I then decided to look at the data while incrementally disregarding older eras. First, I dropped all data from pre-1950 (essentially taking the weighting from 20% to 0%). Then I did the same for the 50’s-70’s (taking weighting from 50% to 0%) and ultimately the 80’s-90’s as well (taking weighting from 80% to 0%). This left us with the ranking for just the 2000’s. What I wanted to see in this case is who moved up and down as we gradually erased history. Below is the image showing the ranking of just the Top 40 (of all 60 programs) when incrementally removing eras from the calculation. I then show the delta – how many positions the programs moved up or down in the rankings. The far right column shows the difference in ranking when considering all eras vs. just the 2000’s. This revealed three interesting groupings of programs – the “Exclusives”, the “Falling Rocks”, and the “Shooting Stars”.
The “Exclusives”: Alabama, Oklahoma, Ohio State, USC, Florida State, Clemson, LSU. No matter how much history you want to include or exclude, these three programs remain in the top ten. Note that I hate the team from Norman as much as anyone on this message board, but that’s what we’re dealing with.
The “Falling Rocks”: Tennessee (-26), Colorado (-25), UCLA (-23), Michigan (-20), Nebraska (-19), Ole Miss (-18), Arkansas (-16), Arizona State (-14), Notre Dame (-13), Syracuse (-13), Washington (-12), Georgia Tech (-11), and North Carolina (-10). A fascinating list. A mix of Fading Powers, Respectable Non-Elites, Smithsonians, and Mediocrities. Most of these are big-name programs that always remain in the limelight. Big-name coaches regularly take these jobs with claims of restoring glory. Many of these programs still get high-ranking recruiting classes and national TV exposure. Which of these programs will stop the skidding and successfully restore results? Recency bias would indicate Notre Dame is making some progress but Nebraska is not.
The “Shooting Stars”: Boise State (+27), Louisville (+26), Boston College (+16), Virginia Tech (+15), Utah (+13), Oklahoma State (+13), Kansas State (+13), Oregon (+12), TCU (+12), Oregon State (+12), Navy (+11), South carolina (+11), Northwestern (+11), Texas Tech (+10), Baylor (+10), Mississippi State (+10). Of course, this is the list I am most interested in. Some of these programs have risen from very low in the overall rankings but remain quite low in the 2000’s rankings and really aren’t that interesting. For example – Kansas State jumped 13 spots from #52 to #39. Similar stories exist for Boston College, Navy, South Carolina, Northwestern, Texas Tech, Baylor, and Mississippi State. That leavesBoise State, Louisville, Virginia Tech, Oregon, Oklahoma State, TCU, and Utah as programs in the “Top 25” of the 2000’s that have jumped substantially in the rankings . Of these programs, only Oregon and Oklahoma State are long-standing members of P5-equivalent conferences. Interestingly, all but Boise State have now established themselves in P5 conferences. Oklahoma State is the only program to do this that has a direct rivalry with one of the "Exclusives”. That may be the most impressive observation from the entire analysis.
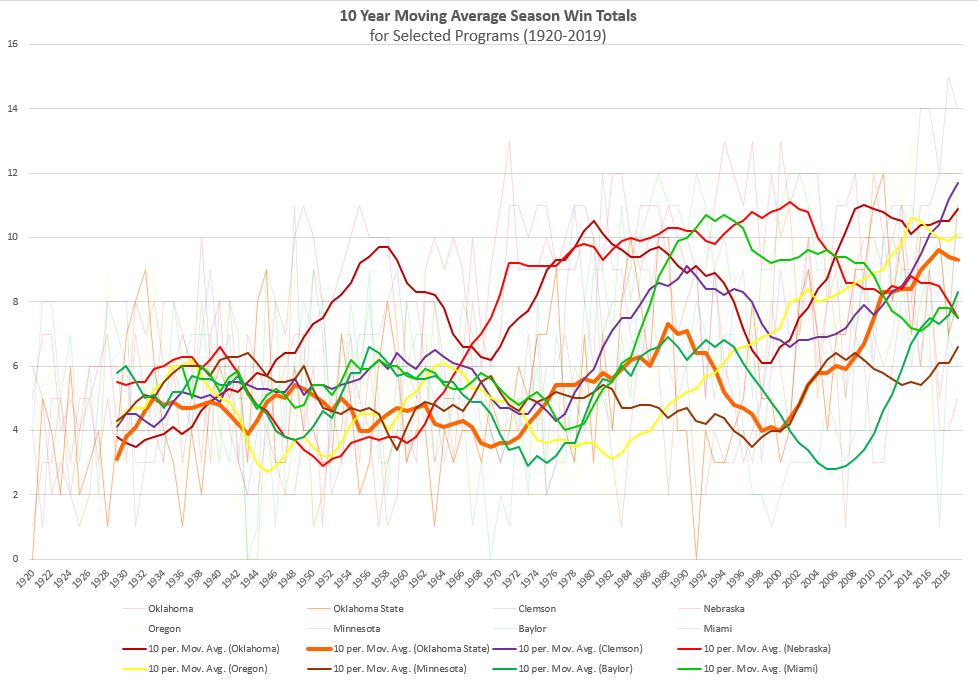
I also took the annual win total from a select group of teams to see what 10-year moving average lines looked like for a few interesting teams from the various categories. Interesting to see what a True Blue Blood (OU), New Blue Blood (Florida State, Clemson, Miami), Fading Power (Nebraska, Michigan, Tennessee), and Rising Power (Oklahoma State) programs look like. Season win totals start in 1920. [Edit - original post chart inadvertently truncated last couple of years. Revised chart posted.]