Great stuff.
3 Likes
Nice work, wow. Thanks for sharing.
2 Likes
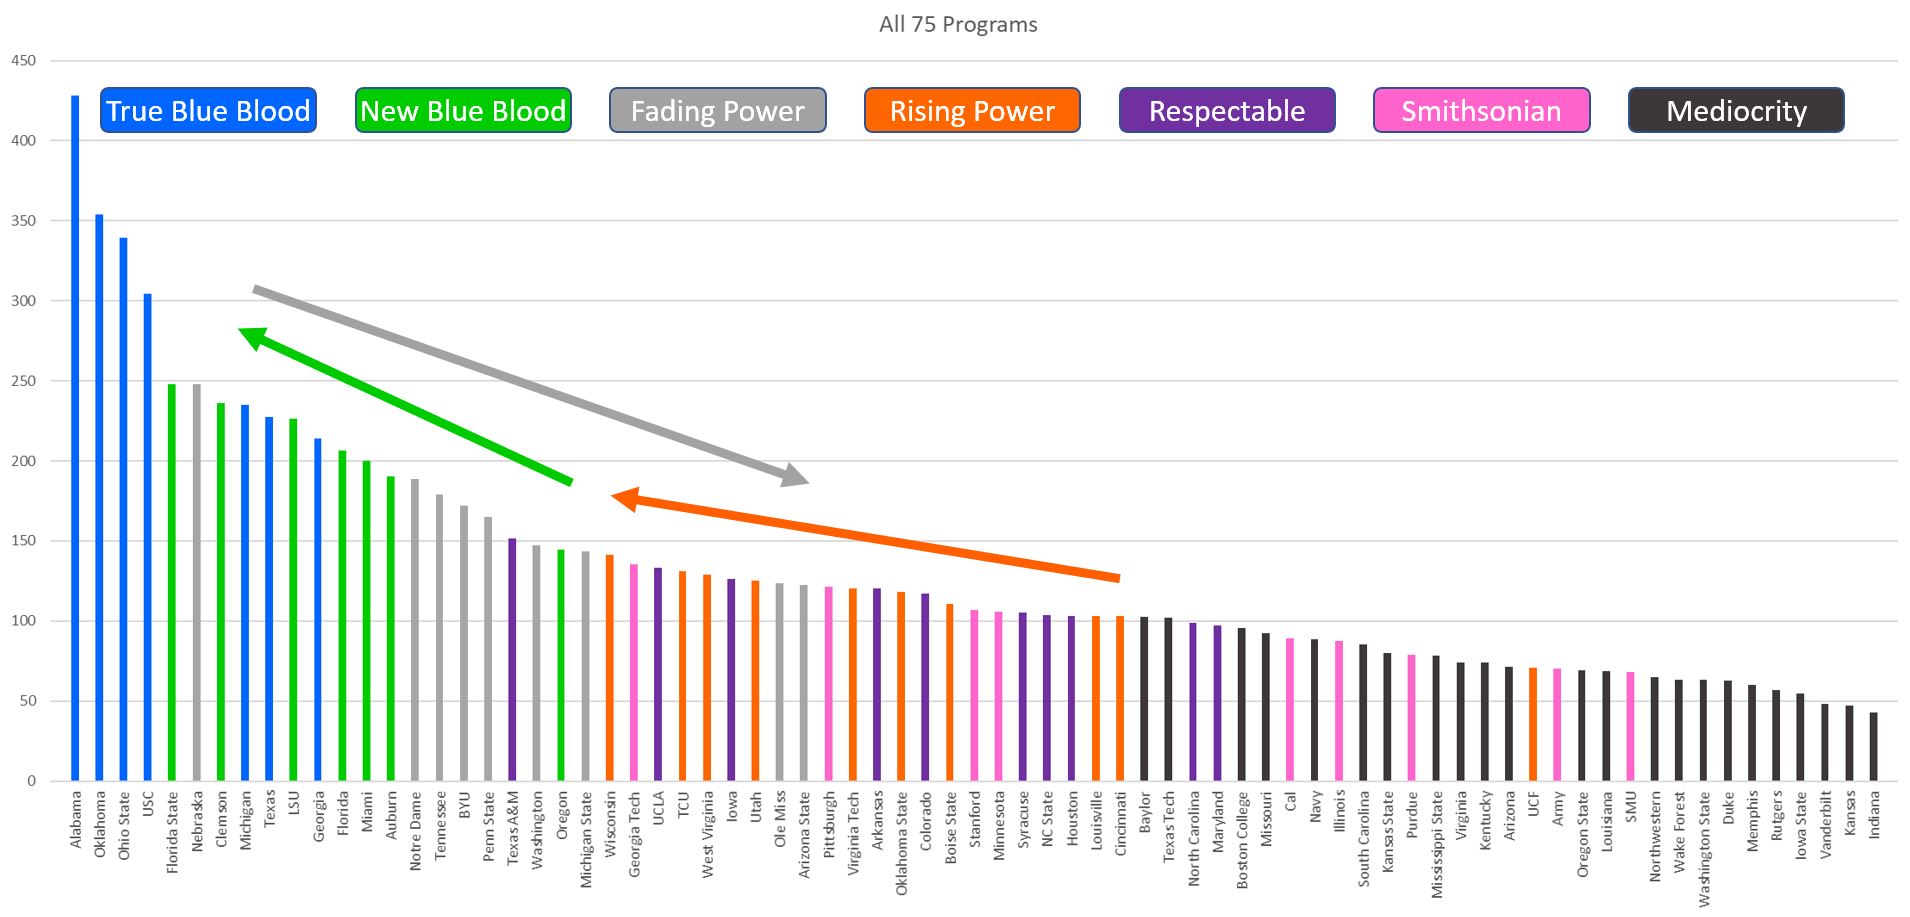
OK, I was just kidding - one more visual of the full list of 75 programs. Shows how big a gap there is with the top 4, the next 10-11, and then everyone else.
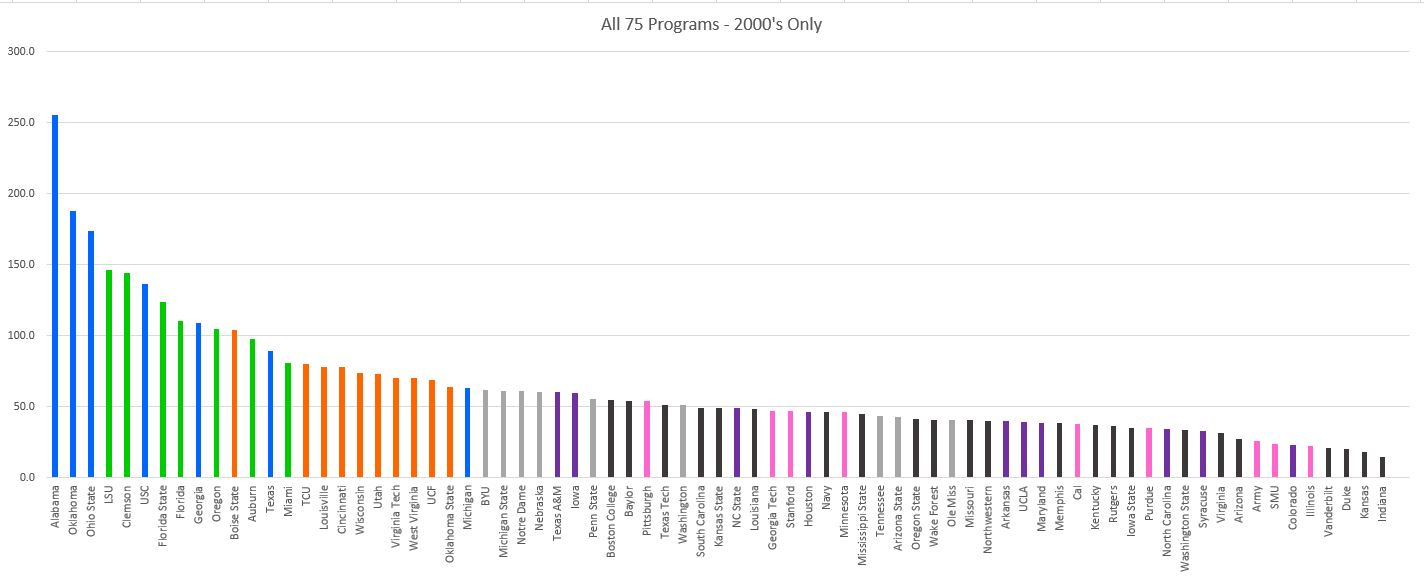
Here is the same chart, only considering data from the 2000’s. I think this shows the model at work! Greens and oranges to the left, Grays to the right.
2 Likes
This made me really think of something: how many years of terrible play would it take for the top 4 to lose their status? Like would 20 years of 5-7 be enough to kick Alabama out?
2 Likes
That’s a good what-if question. Of course 20 more years would be a completely new “era” for my analysis, and if they went 5-7 that whole time, their most recent era would be be ugly and put them into a Fading Power type of category and take them out of the “Exclusives”. I am not going to hold my breath for that, however. Empires like that have Palpatine behind the scenes. 
But for a real example of many years of “5-7”, look what happened to Nebraska. They were barely hanging on as a True Blue Blood in my 2018 study. Add several seasons and they’ve officially fallen out.
2 Likes
Nick Saban IRL

3 Likes
Just added a new graph to my post a few spots above this one that clearly shows the rise of the New Blue Bloods and Rising Powers while also showing the fall of the Falling Powers. I like this view - wish I had created it earlier.
1 Like
Just what you’ve all been waiting for - the updated College Football Blue Blood standings following the 2022 season. Here is the Top 40 (includes 41 due to a tie). You can see who has moved up and down since my first ranking after the 2017 season. Go back to the top of the thread to see the weighting criteria. Remember that this is a long game ranking system. Single seasons don’t make a significant impact in positioning.
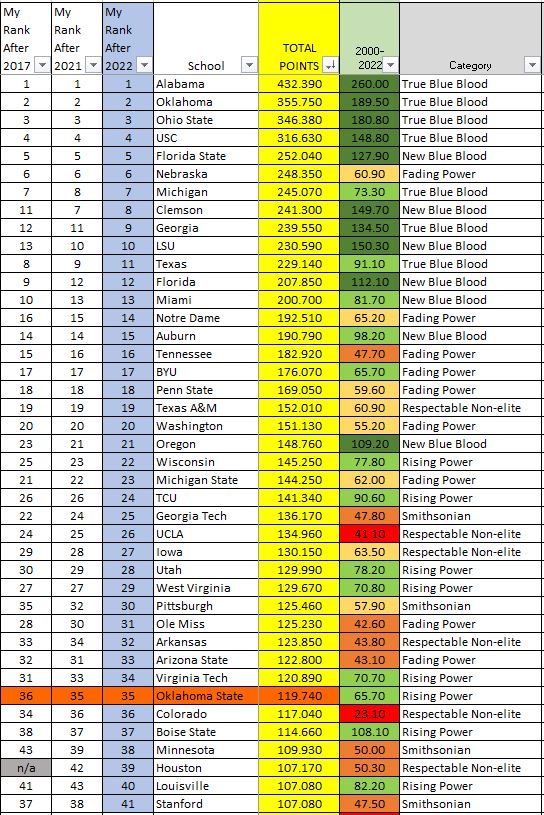
8 Likes
Teams above us that did not qualify for a bowl game this year: #6 Nebraska, #13 Miami, #15 Auburn, #19 Texas A&M, #23 Michigan State, #25 Georgia Tech, #29 West Virginia, #33 Arizona State, and #34 Virginia Tech.
6 Likes
Buy: Tennessee
Sell: Oklahoma State
2 Likes
No debate that the short term reaction supports your position. A lot of factors are involved for continued trends for 10-20 years.
1 Like
One more observation… after the 2017 season I created my original list of Fading Powers and Rising Powers. Thought I would look at where each of those teams stand in the rankings after 5 years. Did my categorization work as a prediction?
Fading Powers - I was right on 5, wrong on 1, and 4 more didn’t change
Michigan from #7 to #7 (no change)
Tennessee from #15 to #16 (dropped one spot EVEN with the success in 2022)
Notre Dame from #16 to #14 (rose 2 spots - good for Notre Dame to stop the slide; probably should be True Blue Blood anyway)
BYU from #17 to #17 (no change)
Penn State from #18 to #18 (no change)
Washington - from #20 to #20 (no change)
Michigan State from #21 to #23 (dropped 2 spots)
UCLA from #24 to #26 (dropped 2 spots)
Arizona State from #32 to #33 (dropped 1 spot)
Colorado from #34 to #36 (dropped 2 spots)
Rising Powers - I was right on 7 and wrong on 2
Oregon from #23 to #21 (rose 2 spots)
Wisconsin from #25 to #22 (rose 3 spots)
TCU from #26 to #24 (rose 2 spots)
West Virginia from #27 to #29 (dropped 2 spots)
Utah from #30 to #28 (rose 2 spots)
Virginia Tech from #31 to #34 (dropped 3 spots)
Oklahoma State from #36 to #35 (rose 1 spot)
Boise State from #38 to #37 (rose 1 spot)
Louisville from #41 to #40 (rose 1 spot)
Of the ones I missed… Notre Dame technically fell into the Fading Powers category by my metrics, but by all practical measurements they are a True Blue Blood (as an Independent they get no points for conference championships). West Virginia fell instead of rose… I think the move to the Big 12 had a lot to do with that. Finally, Virginia Tech lost their long-time coach.
Overall… not bad. ![]()
@OKCDave - thought you might like this.
9 Likes
This is phenomenal stuff. I love the idea of “program ranking” and seeing how schools compare to others historically. The thought you put into this is amazing (I missed when you posted it first, by the way). Great job.
3 Likes
With the completion of the season last night, I have updated my Blue Blood Analysis sheet once again. I have now done this for 7 seasons. OSU continues a slow steady climb… we started at #36 and are now up to #34. Remember, changes to the overall rankings comprehending all-time results take a lot of time. Here is the Top 40 after the 2023 season. In the next post, I will show the Top 25 when only comprehending the 2000-2023 era.
| My Rank After 2017 |
My Rank After 2021 |
My Rank After 2022 |
My Rank After 2023 |
School | 1980+ Yrs in P5 |
TOTAL POINTS |
2000- 2023 |
|---|---|---|---|---|---|---|---|
| 1 | 1 | 1 | 1 | Alabama | 43 | 442.590 | 270.20 |
| 2 | 2 | 2 | 2 | Oklahoma | 43 | 357.750 | 191.50 |
| 3 | 3 | 3 | 3 | Ohio State | 43 | 348.480 | 182.90 |
| 4 | 4 | 4 | 4 | USC | 43 | 320.430 | 152.60 |
| 7 | 8 | 7 | 5 | Michigan | 43 | 270.570 | 98.80 |
| 5 | 5 | 5 | 6 | Florida State | 31 | 257.340 | 133.20 |
| 6 | 6 | 6 | 7 | Nebraska | 43 | 248.850 | 61.40 |
| 11 | 7 | 8 | 8 | Clemson | 43 | 245.200 | 153.60 |
| 13 | 10 | 10 | 9 | LSU | 43 | 244.590 | 164.30 |
| 12 | 11 | 9 | 10 | Georgia | 43 | 243.850 | 138.80 |
| 8 | 9 | 11 | 11 | Texas | 43 | 239.340 | 101.30 |
| 9 | 12 | 12 | 12 | Florida | 43 | 208.350 | 112.60 |
| 10 | 13 | 13 | 13 | Miami | 32 | 204.400 | 85.40 |
| 16 | 15 | 14 | 14 | Notre Dame | 43 | 196.510 | 69.20 |
| 14 | 14 | 15 | 15 | Auburn | 43 | 192.390 | 99.80 |
| 15 | 16 | 16 | 16 | Tennessee | 43 | 186.820 | 51.60 |
| 17 | 17 | 17 | 17 | BYU | 1 | 176.570 | 66.20 |
| 18 | 18 | 18 | 18 | Penn State | 30 | 171.050 | 61.60 |
| 20 | 20 | 20 | 19 | Washington | 43 | 164.530 | 68.60 |
| 19 | 19 | 19 | 20 | Texas A&M | 43 | 153.710 | 62.60 |
| 23 | 21 | 21 | 21 | Oregon | 43 | 152.960 | 113.40 |
| 25 | 23 | 22 | 22 | Wisconsin | 43 | 146.950 | 79.50 |
| 21 | 22 | 23 | 23 | Michigan State | 43 | 144.650 | 62.40 |
| 26 | 26 | 24 | 24 | TCU | 27 | 141.840 | 91.10 |
| 22 | 24 | 25 | 25 | Georgia Tech | 40 | 139.870 | 51.50 |
| 24 | 25 | 26 | 26 | UCLA | 43 | 138.760 | 44.90 |
| 27 | 27 | 29 | 27 | West Virginia | 32 | 133.570 | 74.70 |
| 29 | 28 | 27 | 28 | Iowa | 43 | 132.150 | 65.50 |
| 30 | 29 | 28 | 29 | Utah | 12 | 131.790 | 80.00 |
| 28 | 30 | 31 | 30 | Ole Miss | 43 | 129.330 | 46.70 |
| 35 | 32 | 30 | 31 | Pittsburgh | 32 | 125.760 | 58.20 |
| 31 | 33 | 34 | 32 | Virginia Tech | 32 | 124.590 | 74.40 |
| 33 | 34 | 32 | 33 | Arkansas | 43 | 124.250 | 44.20 |
| 36 | 35 | 35 | 34 | Oklahoma State | 43 | 123.740 | 69.70 |
| 32 | 31 | 33 | 35 | Arizona State | 43 | 123.100 | 43.40 |
| 38 | 37 | 37 | 36 | Boise State | 0 | 119.460 | 112.90 |
| 34 | 36 | 36 | 37 | Colorado | 43 | 117.440 | 23.50 |
| 43 | 39 | 38 | 38 | Minnesota | 43 | 113.530 | 53.60 |
| 42 | 46 | 43 | 39 | Texas Tech | 43 | 109.780 | 59.10 |
| 41 | 43 | 40 | 40 | Louisville | 16 | 109.080 | 84.20 |
3 Likes
Top 25 - Using only points from the 2000-2023 era:
| My Rank After 2017 |
My Rank After 2021 |
My Rank After 2022 |
My Rank After 2023 |
School | 1980+ Yrs in P5 |
TOTAL POINTS |
2000- 2023 |
|---|---|---|---|---|---|---|---|
| 1 | 1 | 1 | 1 | Alabama | 43 | 442.590 | 270.20 |
| 2 | 2 | 2 | 2 | Oklahoma | 43 | 357.750 | 191.50 |
| 3 | 3 | 3 | 3 | Ohio State | 43 | 348.480 | 182.90 |
| 13 | 10 | 10 | 9 | LSU | 43 | 244.590 | 164.30 |
| 11 | 7 | 8 | 8 | Clemson | 43 | 245.200 | 153.60 |
| 4 | 4 | 4 | 4 | USC | 43 | 320.430 | 152.60 |
| 12 | 11 | 9 | 10 | Georgia | 43 | 243.850 | 138.80 |
| 5 | 5 | 5 | 6 | Florida State | 31 | 257.340 | 133.20 |
| 23 | 21 | 21 | 21 | Oregon | 43 | 152.960 | 113.40 |
| 38 | 37 | 37 | 36 | Boise State | 0 | 119.460 | 112.90 |
| 9 | 12 | 12 | 12 | Florida | 43 | 208.350 | 112.60 |
| 8 | 9 | 11 | 11 | Texas | 43 | 239.340 | 101.30 |
| 14 | 14 | 15 | 15 | Auburn | 43 | 192.390 | 99.80 |
| 7 | 8 | 7 | 5 | Michigan | 43 | 270.570 | 98.80 |
| 26 | 26 | 24 | 24 | TCU | 27 | 141.840 | 91.10 |
| 10 | 13 | 13 | 13 | Miami | 32 | 204.400 | 85.40 |
| 41 | 43 | 40 | 40 | Louisville | 16 | 109.080 | 84.20 |
| n/a | 44 | 45 | 45 | Cincinnati | 9 | 105.330 | 80.10 |
| 30 | 29 | 28 | 29 | Utah | 12 | 131.790 | 80.00 |
| 25 | 23 | 22 | 22 | Wisconsin | 43 | 146.950 | 79.50 |
| 27 | 27 | 29 | 27 | West Virginia | 32 | 133.570 | 74.70 |
| 31 | 33 | 34 | 32 | Virginia Tech | 32 | 124.590 | 74.40 |
| n/a | 61 | 61 | 63 | UCF | 1 | 74.340 | 72.50 |
| 36 | 35 | 35 | 34 | Oklahoma State | 43 | 123.740 | 69.70 |
| 16 | 15 | 14 | 14 | Notre Dame | 43 | 196.510 | 69.20 |
6 Likes
One last note - I think 2024 will start a NEW ERA. This comprehends the new 12-team CFP and NIL. I will somehow adjust the points allocated for bowls vs. the CFP. The value of non-CFP bowl wins has dropped materially.
7 Likes
If this was day 1 post football season, I look forward to seeing what you can do with the remaining 228 days!
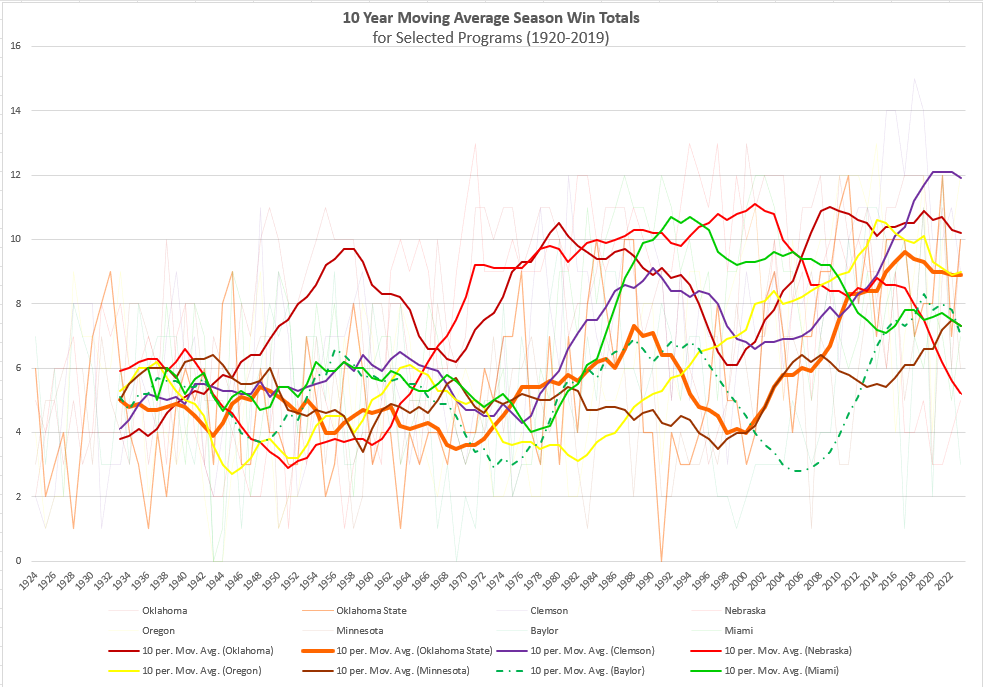
Here’s a look at 10-year moving average win totals for a quasi-random selection of programs. Oregon, Nebraska, and Minnesota do take a greater hit than others due to 2020 Covid cancellations dictated by their conference.
1 Like
I hate seeing even more evidence that OU is an absolute historical monster. Excited to hopefully never play them again.
That said, the new look Big 12 ain’t exactly a powerhouse. How about that angle? Using both the long-term and the last 23 year data, break these into conferences for 2024 and give a “conference power ranking.”
4 Likes
At some point, every giant falls. OU’s time to drop off is coming.
1 Like